
(ATLANTA, Ga.) — NEWS: Down Payment Resource (DPR), the housing industry authority on homeownership program data and solutions, today released its Q4 2025 Homeownership Program Index (HPI) report, identifying 2,619 programs. While the total count is five programs fewer than the prior quarter, it marked a 6% increase from a year earlier, rising from 2,466 programs in Q4 2024. The year-over-year (YoY) growth reflects continued expansion and refinement of program options amid persistent housing affordability challenges across much of the country.
Down payment assistance (DPA) continues to play a critical role in helping lenders expand access to homeownership. On average, these programs provide approximately $18,000 in benefits, reducing a homebuyer’s loan-to-value ratio by 8.8% and strengthening borrower qualification and overall loan profiles. Beyond down payments, many programs also help cover closing costs, prepaid expenses, mortgage rate buydowns and reductions in mortgage insurance costs. In some cases, eligible buyers can layer multiple programs to further improve affordability.
“Affordability will remain the defining challenge for homebuyers in 2026, and down payment programs are one of the most practical tools lenders have to address it,” said DPR Founder and CEO Rob Chrane. “When DPA lowers loan-to-value ratios and helps cover upfront costs, it doesn’t just improve borrower eligibility; it improves loan quality. As prices remain elevated and rates fluctuate, lenders that proactively integrate DPA into their origination strategies are better positioned to turn qualified demand into sustainable homeownership.”
KEY Q4 2025 HPI REPORT FINDINGS:
An examination of the 2,619 homeownership programs on January 1, 2026, resulted in the following key findings:
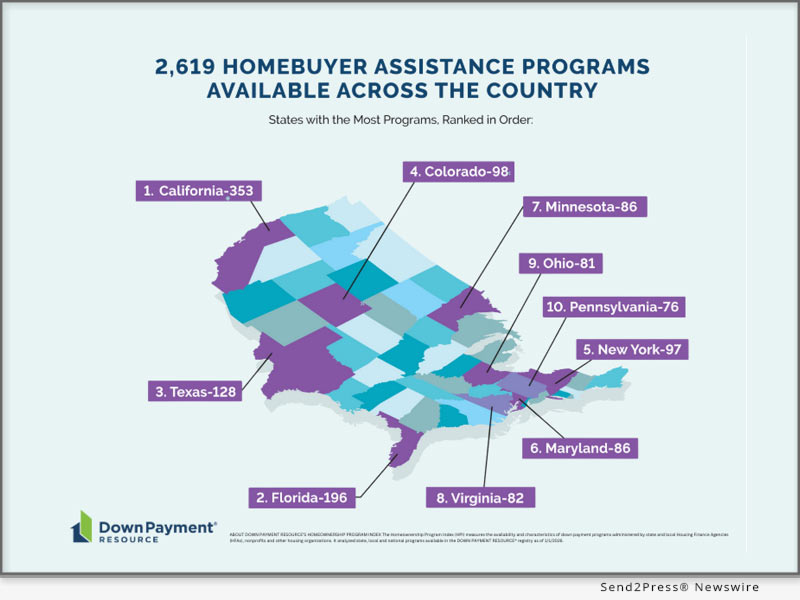
* Every U.S. county has at least one DPA program, and more than 2,000 have 10 or more. By state, California has the most with 353 programs from 223 providers. Florida has 196 programs from 128 providers. Texas has 128 programs from 63 providers.
* Benefits and home income caps are rising. 1,599 programs (62%) have an average income limit exceeding $100k across the program’s footprint. Additionally, 270 programs (10%) do not have income restrictions, thereby increasing the number of buyers who may qualify for assistance. This “income-free” requirement represents a 15% YoY increase, giving lenders a wider box to qualify borrowers.
* Support for first-time buyers and first-gen buyers. 1,639 programs (63%) are open to first-time buyers, an 8% YoY rise. First-generation homebuyers are supported by 33 programs, a 32% YoY increase. First-generation homebuyers are defined as buyers and their parents who have never owned a home. 980 programs (37%) are available to repeat buyers, a 3% YoY increase.
* Servicemembers and Veterans are exempted from 246 programs (9%). This exemption allows them to qualify even if they have previously purchased a residence, representing a 12% YoY increase.
* Buyers of newly constructed homes are supported by 2,113 (81%) of the programs. These programs typically help cover a portion of the buyer’s down payment and/or closing costs, similar to assistance for resale properties. This is a slight increase from Q3 and is a new data point being tracked by DPR with no historical YoY data.
* Buyers of multi-family housing (1-4 units) are eligible for 923 programs, a 15% YoY increase. Of these, a growing number of programs support purchasing three-unit homes (607) and four-unit homes (580), both of which saw a 13% YoY increase. Investing in multifamily properties can generate cash flow and offer tax advantages to buyers.
* Buyers of manufactured housing are supported by 1,014 programs, a slight slide from the previous quarter but 14% higher YoY. New manufactured homes cost roughly $85 per square foot, compared with about $166 per square foot for site-built homes, according to the Manufactured Housing Institute, highlighting the relative affordability of manufactured homes.
* Program types vary widely. The majority of programs (1,461, or 56%) are second-mortgage programs, up 4% YoY, while 242 programs are first-mortgage programs, up 1% YoY. 37 were “other assistance” programs, meaning they consist of components that don’t neatly fit into the other categories, such as an interest rate reduction benefit. Other assistance programs are 85% higher YoY. 273 are combined assistance programs, 18% higher YoY. 207 programs are grants, up 17% YoY. 139 programs are below-market-rate (BMR) or resale-restricted, up 49% YoY, giving low- to moderate-income households more opportunities to achieve homeownership.
* The majority of DPA loans are structured to be forgivable. 1,035 DPA programs (53%) offer partial or full forgiveness over time – a 5% YoY increase. These programs may require that homebuyers meet specific requirements, such as living in the home as their primary residence for a certain number of years.
* DPA is offered by a wide variety of providers. 1,027 programs (39%) were offered through municipalities or local program providers, a 6% YoY increase. 562 programs (21%) are sponsored by nonprofits, a 7% YoY increase. State housing authorities (HFAs) accounted for 466 (18%) of programs, 1% higher YoY.
* Some programs offer special incentives based on the buyer’s occupation or other characteristics. Of the 201 special incentive programs, 71 (35%) support educators, up 4% YoY. 56 programs (28%) assist Native American homebuyers, 19% higher YoY. 54 programs (27%) are available to military Veterans (up 10% YoY).
A more detailed analysis of the Q4 2025 HPI findings, including infographics and examples of the programs described in this release, can be found on DPR’s website at: https://downpaymentresource.com/professional-resource/down-payment-assistance-holds-near-record-levels-in-q4-2025-as-program-flexibility-expands/
For a complete list of homebuyer assistance programs by state, visit: https://downpaymentresource.com/wp-content/uploads/2026/01/HPI-state-by-state-data.Q42025.pdf
Members of the media are encouraged to contact DPR for data specific to their reporting needs.
METHODOLOGY:
Published quarterly, DPR’s HPI surveys the funding status, eligibility rules and benefits of U.S. homebuyer assistance programs administered by state and local housing finance agencies, municipalities, nonprofits and other housing organizations. DPR communicates with over 1,300 program providers throughout the year to track and update the country’s wide range of homeownership programs, including down payment and closing cost programs, Mortgage Credit Certificates (MCCs) and affordable first mortgages, in the DOWN PAYMENT RESOURCE(r) database.
ABOUT DOWN PAYMENT RESOURCE:
With a database that tracks over 2,600 programs and toolsets for mortgage lenders, multiple listing services (MLSs) and API users, Down Payment Resource (DPR) is the housing industry’s authority on homeownership program data and solutions, helping housing professionals connect homebuyers with the assistance they need. DPR frequently lends its expertise to nonprofits, housing finance agencies, policymakers, government-sponsored enterprises and trade organizations seeking to improve housing affordability. Its technology is used by seven of the top 25 mortgage lenders, two of the largest real estate listing websites and 600,000 real estate agents. For more information, visit www.downpaymentresource.com.
Related link: https://www.downpaymentresource.com/
This version of news story was published on and is Copr. © eNewsChannels™ (eNewsChannels.com) – part of the Neotrope® News Network, USA – all rights reserved. Information is believed accurate but is not guaranteed. For questions about the above news, contact the company/org/person noted in the text and NOT this website. Published image may be sourced from third party newswire service and not created by eNewsChannels.com.


